01The challenge
The same KPIs had to work on a ‘mini movie screen’ in a boardroom and on a phone in a CEO’s hand. Production capacity, mine health, incident reports, required output and financial tracking all compete for attention.
The first sector, Kutch Copper Ltd (KCL), brought sales, marketing and production KPIs across cathode, copper rod, CCR, gold, silver and by-products, each with MTD and YTD views.
02Approach
Learn the domain
Took part in RFP discussions and interviewed SMEs and stakeholders to understand business goals and how CEOs actually read the numbers.
Low-fidelity first
Approved lo-fi wireframes for MTD and YTD views settled what matters most before any visual design.
v1.0 light, then v2.0 dark
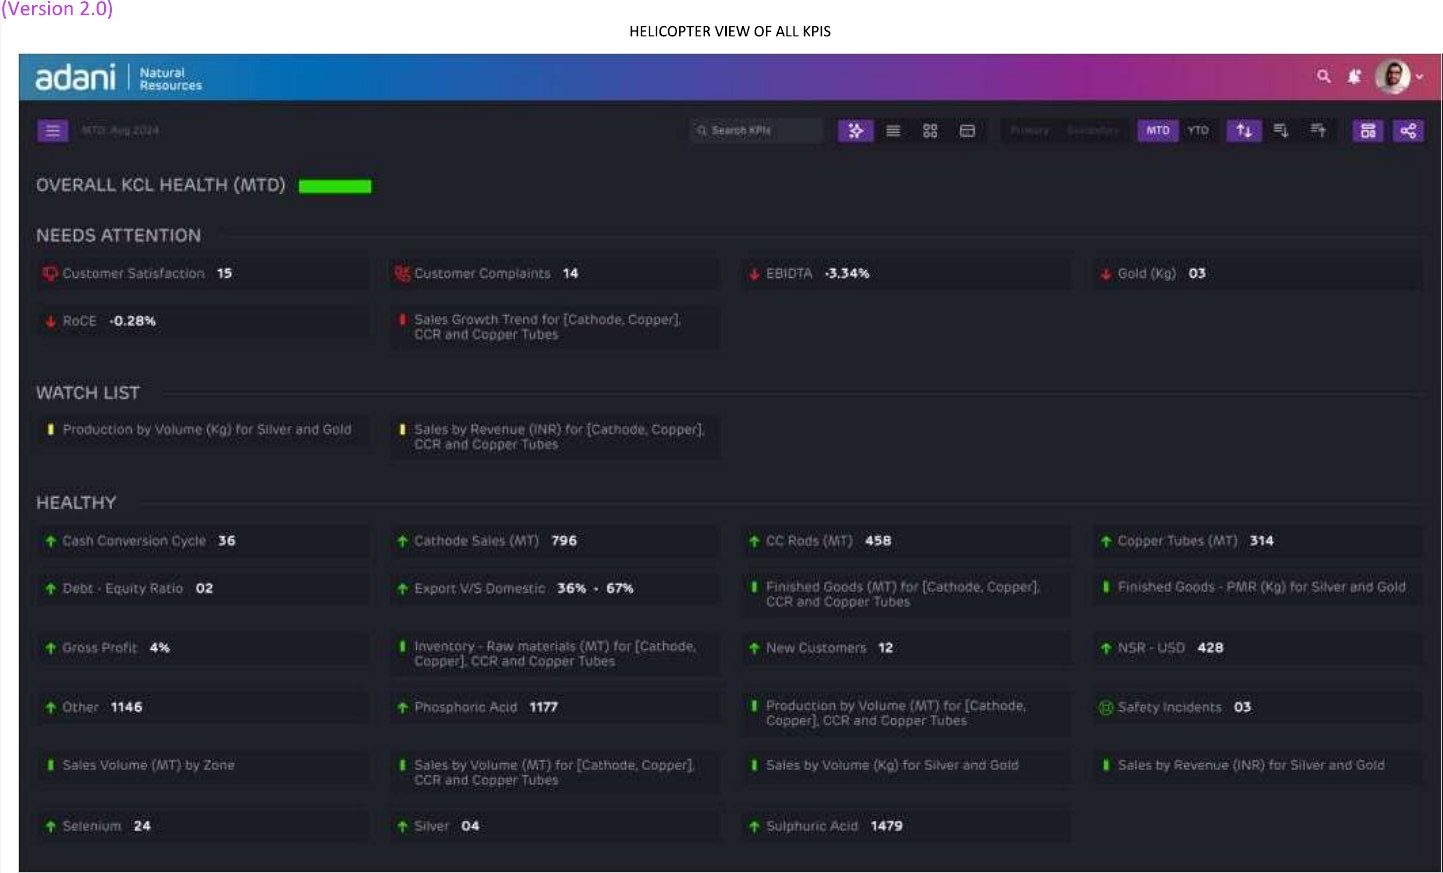
Hi-fi v1.0 established the KPI cards and charts; v2.0 moved to a dark theme built for huge screens and added a helicopter view.
Review and sign-off
Designs were reviewed with HODs and CEOs and signed off.
03What I did
- Gathered business and user requirements through stakeholder interviews, documentation, goals and objectives
- Analysed data and KPIs and planned UX/UI activities for the project
- Created information architecture, wireframes, workflows, task flows, visual designs and responsive UIs
- Built design guides from the client’s brand guidelines
- Designed card view, grid view, detailed KPI view, view customisation, primary and secondary production with a geo map, and mobile views
04Key design decisions
Helicopter view by status
In v2.0 every KPI is grouped into Needs attention, Watch list and Healthy, so a CEO sees exceptions first instead of scanning dozens of charts.
Dark for the big screen
A dark canvas keeps a 500-inch display readable in a boardroom and lets red/green status signals carry the meaning.
Same KPIs, three densities
Card view, grid view and a detailed KPI view let the same data serve a quick glance, a comparison or a deep dive.
Mobile as a list, not a shrunken wall
On phones the dashboard becomes expandable MTD/YTD summaries with trend arrows, not a miniature of the big screen.
05Gallery
Screens shown at review quality; click any image to zoom. Higher-resolution versions are available on request.
06Outcome
Designs were reviewed with the heads of department and CEOs and signed off. The work defined a reusable dashboard language (KPI cards, status grouping, view customisation and mobile summaries) for sector CEOs.